Agentic Org Charts: How We Built AI-Generated Stakeholder Maps That Actually Work

David Golub
Stakeholder Mapping is Broken
Every enterprise deal has a power structure. There’s an executive sponsor who controls the budget, a champion advocating internally, a technical evaluator running the POC, and almost always a detractor. Knowing who these people are and how they relate to each other is the single highest-leverage activity in strategic and enterprise B2B sales.
Yet in practice, stakeholder maps still live in slide decks, spreadsheets, or the heads of individual reps. CRM records tell you who is at a company, but they tell you nothing about who reports to whom, who influences whom, or who is actively blocking your deal.
Org chart relationship information is scattered across email threads, meeting transcripts, LinkedIn profiles, and CRM metadata, but synthesizing it into a coherent picture is extremely manual and goes out of date quickly.
We wanted to change that. When given an account, an agent should be able to assemble a complete organizational chart with reporting relationships, stakeholder roles, engagement status, and cited evidence - without a rep lifting a finger.
Org Charts are Agent Problem, Not a Data Problem
On the surface, building an org chart looks like a data aggregation task. Pull contacts from the CRM, sort by title seniority, connect the dots. However, seniority alone doesn’t determine reporting structure.
For example, a “VP of Strategy” might report to the CEO or to the COO.
A “Director of Platform Engineering” could sit under a VP of Engineering or a CTO, depending on how the company is organized. The same title means different things at different companies.
The information that resolves this ambiguity is buried in unstructured signals, such as:
an email where someone CC’d their boss
a meeting transcript where someone introduced themselves as “reporting to Sarah,”
a LinkedIn profile showing a department that narrows the possibilities.
No single data source has the answer. An agent has to reason across multiple sources, weigh conflicting evidence, and produce a best-effort hierarchy with calibrated confidence.
This makes org chart generation fundamentally different from, say, pulling a list of contacts or summarizing a meeting. It requires:
Multi-source retrieval: CRM contacts, web search results, existing chart data, and uploaded files (CSVs, images, LucidChart exports) all need to be considered.
Structural reasoning: The agent must infer a tree from a flat list of people, using title semantics, department groupings, and explicit evidence.
Evidence attribution: Every reporting relationship needs a citation—an email, a transcript, a LinkedIn URL—so reps can validate the chart rather than blindly trusting it.
Graceful degradation: When evidence is thin, the agent should still produce a plausible structure while clearly marking what’s inferred versus confirmed.
A single prompt-and-pray approach would not solve this problem. We needed an agentic solution.
The Org Chart Agent Architecture
The org chart agent is part of Rox’s broader assistant framework, where specialized “worker agents” handle domain-specific tasks. The org chart modification agent has access to five tools:
search_internal_contacts — semantic search over CRM contacts, scoped to specific companies
lookup_internal_contacts — exact-match lookups by name or email
get_org_chart_for_company — retrieves any existing chart (with LLM-based relevance ranking when the chart exceeds 50 people)
do_batched_web_search — finds executives and leadership team members not yet in the CRM
emit_org_chart — the output tool: emits the final org chart as a TSV string
Multimodal Ingestion with Reducto
One of the most important things we learned early on is that org charts don’t always start start from scratch. Reps often have org charts in some format such as:
PDF exported from a customer’s annual report
Screenshot of a LucidChart diagram someone shared in Slack
CSV exported from another tool.
If we couldn’t ingest existing charts, we create unnecessary friction by asking reps to re-enter information that already existed.
The generation wizard supports three ingestion paths, each handled differently by the agent:
CSV/TSV files are the simplest case. The file is uploaded, stored as a conversation file, and attached to the agent’s hidden message. The agent’s instructions tell it to match the CSV line by line, preserving the original ordering, while inferring manager relationships from department and role signals. When the agent is unsure about a manager assignment, it fact-checks against the web and cites the source.
PDFs and images are where things get interesting. A screenshot of an org chart is semantically rich, as it encodes hierarchy through spatial layout, connecting lines and text labels. However, an LLM can’t reason about pixel data directly. We needed a document intelligence layer that could extract structured content from visual inputs before the agent ever sees them.
This is where Reducto became critical infrastructure for us. When a user uploads a PDF or image for org chart generation, the file goes through Reducto’s parsing pipeline with org-chart-specific configuration. We pass two agentic processing directives: a layout-scoped directive that detects the full org chart as a figure region, and a figure-scoped directive that captures all entities and their directional relationships. The result is a structured text representation that the agent can reason about, including names, titles, reporting lines, and spatial relationships all extracted and described in natural language.
The quality of the extraction here matters enormously. A missed name or a misread title cascades through the entire generated chart.
We’ve been continually impressed by Reducto’s output quality, and a shoutout is warranted to Adith and the Reducto team - their support has been exceptional.
When we ran into edge cases with org chart PDDs that contain non-standard diagram layouts, they worked directly with us to tune the extraction. Having a document intelligence partner that treats your use case as a first-class concern, rather than a generic “parse this PDF” API, made a material difference in the reliability of the end-to-end pipeline.
Building on What Exists with The Existing Chart as Context
Org charts are a living and breathing document. A rep might generate an initial chart from a CSV, manually add a few contacts they met at a conference, and then months later want to refresh the chart with updated web data. The system needs to understand what already exists and build on top of it, not overwrite it.
This matters for two reasons. First, it prevents the agent from producing a chart that contradicts what the rep already knows and has manually validated. If a rep confirmed a reporting relationship last week and marked it as “Confirmed,” a regeneration shouldn’t silently demote it to “Likely” based on weaker web evidence. Second, it lets the agent reference existing node IDs in parent_org_chart_person_id, creating new nodes that slot into the existing hierarchy rather than building a disconnected parallel structure.
For large accounts, existing charts can have hundreds of contacts. Loading all of them into the agent’s context would blow the token budget. We solved this with an LLM-based relevance ranker that evaluates each person’s summary against the current query and returns only the top 50. When a user asks to “add the engineering leadership,” the scorer filters down to the people most relevant to that request, giving the agent a focused context window without losing the structural foundation.
This continuity model (load existing state, rank for relevance, extend rather than replace) is what turns the org chart from a one-shot generation into a living document that improves over time as the rep’s understanding of the account deepens.
Evidence-Grounded Hierarchy by Making the Agent Show Its Work
The hardest part of org chart generation is justifying the relationships between them. Anyone can guess that a VP of Engineering reports to the CTO, but when a rep presents this chart to their sales leader in a deal review, “the AI guessed based on titles” isn’t going to cut it.
We solved this with two fields that the agent must populate for every reporting relationship:
A free-text field containing inline citations. The agent embeds <rox_object> tags that reference specific evidence—an email thread, a meeting transcript, a LinkedIn profile, or a web search result. These citations are structured data (email IDs, meeting IDs, URLs) that the frontend can render as clickable links.
A three-level confidence enum: - Confirmed — direct evidence (explicit mention in an email, visible on a published org chart, stated in a meeting) - Likely — inferred from titles, departments, or indirect signals - Unlikely — weak or no evidence for the relationship
This two-field design carries an implicit contract: the agent is expected to show its work. The prompt instructions reinforce this by providing hierarchy heuristics (CEO → C-level → VP → Director → Manager → IC) as a fallback, but the agent is explicitly told to cite evidence when available and flag uncertainty when it’s not.
In practice, this means a generated org chart might show a CTO at the top with “Confirmed” confidence (referenced from the company website), a VP of Engineering reporting to the CTO with “Likely” confidence (inferred from LinkedIn titles), and a Director of Platform reporting to the VP with “Confirmed” confidence (because a QBR email explicitly mentioned the reporting line, cited with a clickable email reference).
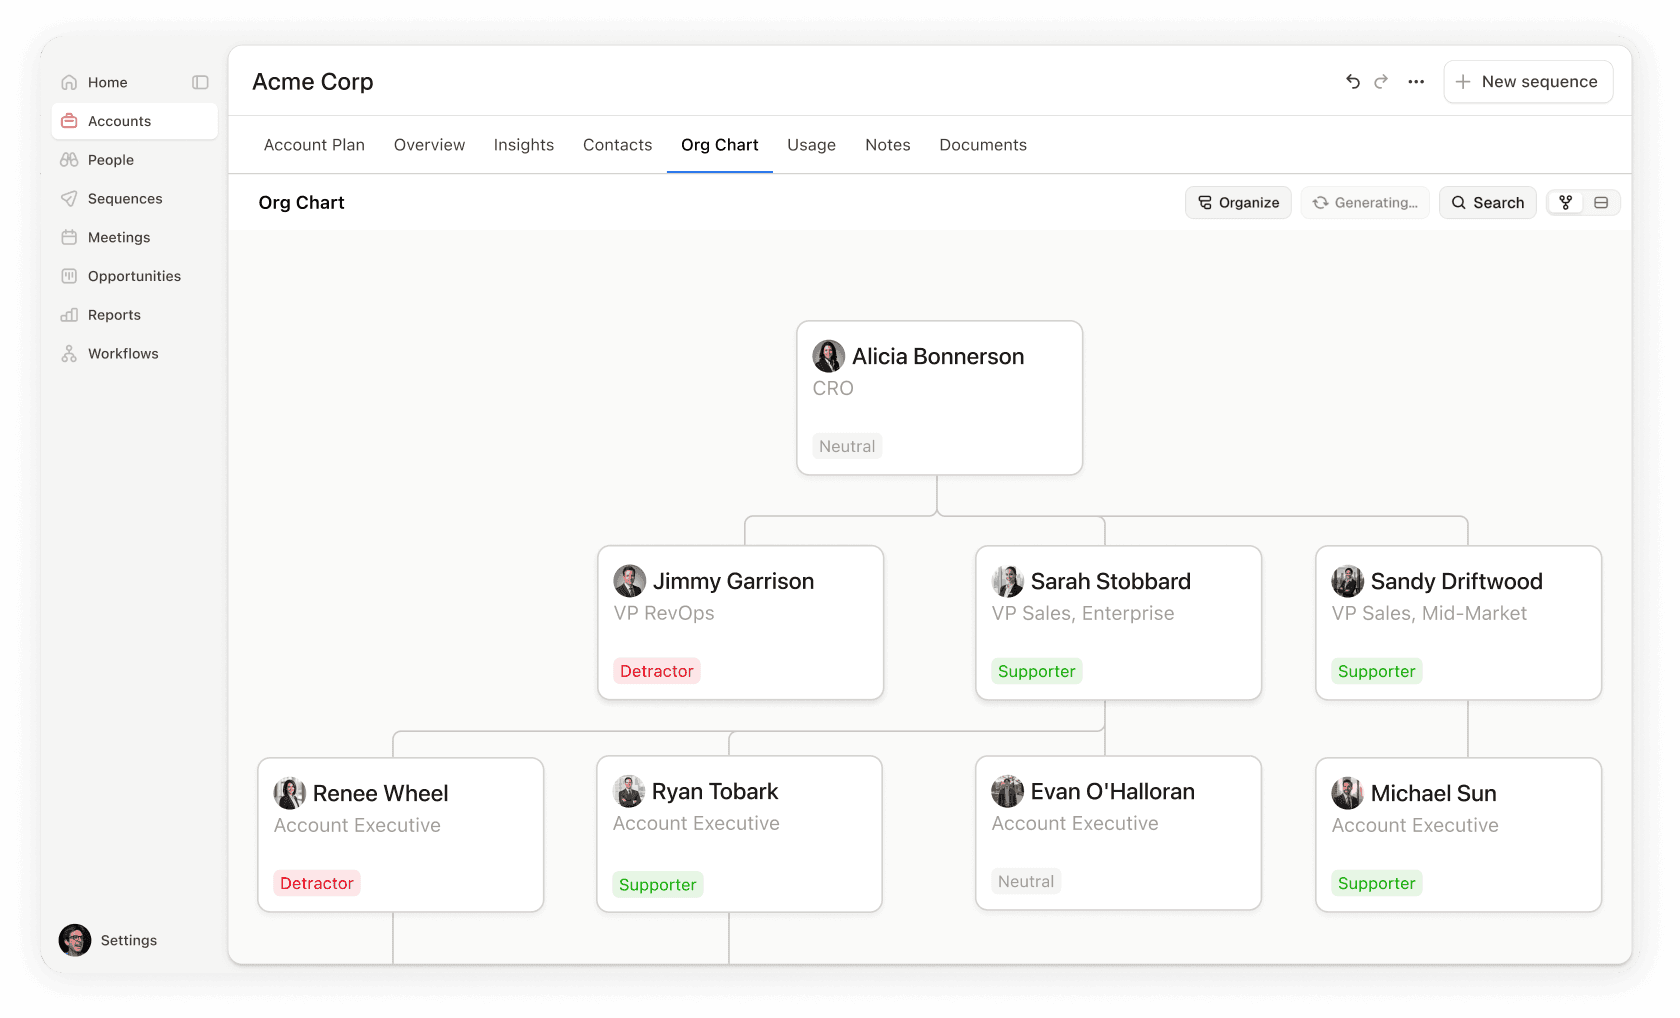
The frontend renders this as visual differentiation. Confirmed relationships appear solid and likely relationships appear with a different indicator. The rep can click through to the source material to verify. The org chart becomes an evidence map, not just a hierarchy diagram.
Using Two-Phase Commit for Managing Org Chart Changes
A critical design constraint: the org chart agent cannot save anything to the database. It only proposes structures. This a deliberate architectural choice enables two very different consumption paths:
Path 1: Interactive (User-in-the-Loop)
When a user triggers org chart generation from the UI, either through the Rox assistant chat or through the “Add Relationships” drawer on an account page, the flow is:
The frontend sends a POST /org_chart/generate request, which creates a PENDING record in the database and queues an SQS task.
The task executor spins up a StartStreamService, sending a hidden message to the agent with the company context and any user instructions or uploaded files.
The agent runs its research loop—searching CRM contacts, hitting the web for missing executives, consulting any existing chart—and produces a TSV via emit_org_chart.
The interceptor parses the TSV into structured OrgChartCreateOrUpdate data. The executor captures the first org_chart_create_or_update event from the stream and writes it to the generation record as COMPLETED.
The frontend polls the generation status endpoint, and when it sees COMPLETED, presents the proposed people as editable rows in a drawer.
The user reviews, edits, reorders, and confirms. Only then does the data get committed to the org chart via PUT /org_chart/{id}.
This flow respects a core principle: the agent proposes, the human disposes. The async polling architecture (with SQS deduplication guards to prevent duplicate execution) means the user can navigate away and come back and the result will be waiting for them.
Path 2: Automated (Workflow-Driven)
For automated pipelines (triggered by Temporal workflows when a deal stage changes, a new account is created, or on a recurring schedule) the flow is different. There’s no human review step, the chart is generated and persisted atomically. This is acceptable because workflows are configured by admins who’ve explicitly opted into automated generation, and the confidence metadata (reports_to_validated) provides the audit trail.
The shared infrastructure between these two paths – the same agent, the same prompt, the same TSV format, the same interceptor – means improvements to the agent’s reasoning benefit both interactive and automated flows simultaneously.
The Frontend Contract by Rendering Agentic Org Chart Recommendations
On the frontend, org charts live in a React Flow-based widget that supports both a visual graph view and a tabular editing view. The widget is used in two contexts:
as a component in Rox’s custom apps framework (where it behaves like a configurable grid widget)
as a first-party account feature (where it’s backed by the org chart API with full CRUD).
The agent’s output maps to the widget’s data model through a simple contract and the widget handles layout computation, edge rendering, collapse/expand, and all the interactive editing operations independently of how the data was generated.
The widget also supports dual-mode interaction: a visual graph view for spatial understanding and a tabular editing view for bulk operations. Users can toggle between them freely. This turned out to be essential. Some users prefer dragging nodes around a canvas, while others prefer editing a spreadsheet. Both views share the same underlying data model and changeset tracking, so edits in one view are immediately reflected in the other.
We Learned Org Charts are a System Design Challenge
Building org charts that actually work means
Reps trust them enough to present in deal reviews
They capture relationships CRM records miss
They cite their sources and acknowledge their uncertainty
This level of output quality required treating the problem as a systems design challenge, not just a prompt engineering exercise. The agent is the brain, but the interceptor, the evidence model, the document intelligence pipeline, the proposal pattern, and the async execution framework are the nervous system that makes it useful.
The Future for Org Charts is Proactive Multithreading and Outreach
Generating the org chart is only the beginning. The chart becomes far more powerful when it's a live artifact that reflects the ongoing state of every relationship in a deal.
Because Rox's unified knowledge graph reconciles emails, meetings, and CRM activities into a single event timeline per contact, the org chart widget pulls in last-activity data for every mapped stakeholder. Each node shows when the rep last interacted with that person and through what channel - email, meeting, or call. This transforms the chart from a static hierarchy into a real-time engagement heatmap. A rep can glance at the chart and immediately see which key stakeholders have gone cold.
But surfacing activity is passive. The next step is making the chart proactive. The vision is a recommended action list on each node, contextualized by relationship type, engagement history, and deal stage. Then, a single click drafts the email, schedules the meeting, or queues the sequence. The org chart stops being a map you look at and becomes a cockpit you act from. Multithreading a deal (engaging multiple stakeholders in parallel across different levels of the org) is the strategy that separates good reps from great ones. Making it effortless from a single interface is where the org chart feature is headed.
Similar Articles
We build with the best to make sure we exceed the highest standards and deliver real value.


