Building a Unified Knowledge Graph: How We Solved Multi-Source Event Reconciliation at Scale

Sanchit Gupta

The Problem: Fragmented Customer Context
Picture this: A sales rep is preparing for a crucial follow-up call with a prospect. They need to know what was discussed in previous meetings, which emails were sent, and who from their team has engaged with this account.
So they open:
Google Calendar to see when meetings happened
Gong to review call recordings and transcripts
Salesforce to check logged activities and notes
Gmail to scan through email threads
After 15 minutes of clicking through tabs and searching across systems, they've pieced together a fragmented picture. But they still miss critical context—like that meeting their colleague had last week, or the email thread that went cold after a specific call.
This isn't just inefficient. It's a fundamental problem: revenue teams have a trove of communication data locked away in different systems, but no single source of truth to analyze all interactions and surface actionable insights.
When a deal stalls, reps can't easily answer questions like "What happened after our demo?" or "When did engagement drop off?" The data exists, but it's scattered.
The Challenge: Messy Data Across Vendor Systems
Building a unified view isn't just about pulling data from multiple sources. It's about reconciling fundamentally incompatible representations of the same reality.
Three Sources of Complexity
1. Data Lives in Silos
Google/Microsoft own calendar and email data, Salesforce controls the CRM, and tools like Gong own the call transcripts
2. Every Vendor Uses Different Schemas
Each vendor structures meeting data differently. Google Calendar handles recurring meetings with instance identifiers whereas Microsoft Outlook represents recurring meetings as linked series. Salesforce has a relaxed schema where reps manually log meetings with inconsistent field usage
3. Vendor-Specific Anomalies
Beyond schema differences, each system has quirks: Some systems record "scheduled start time" while others record "actual join time" and so on.
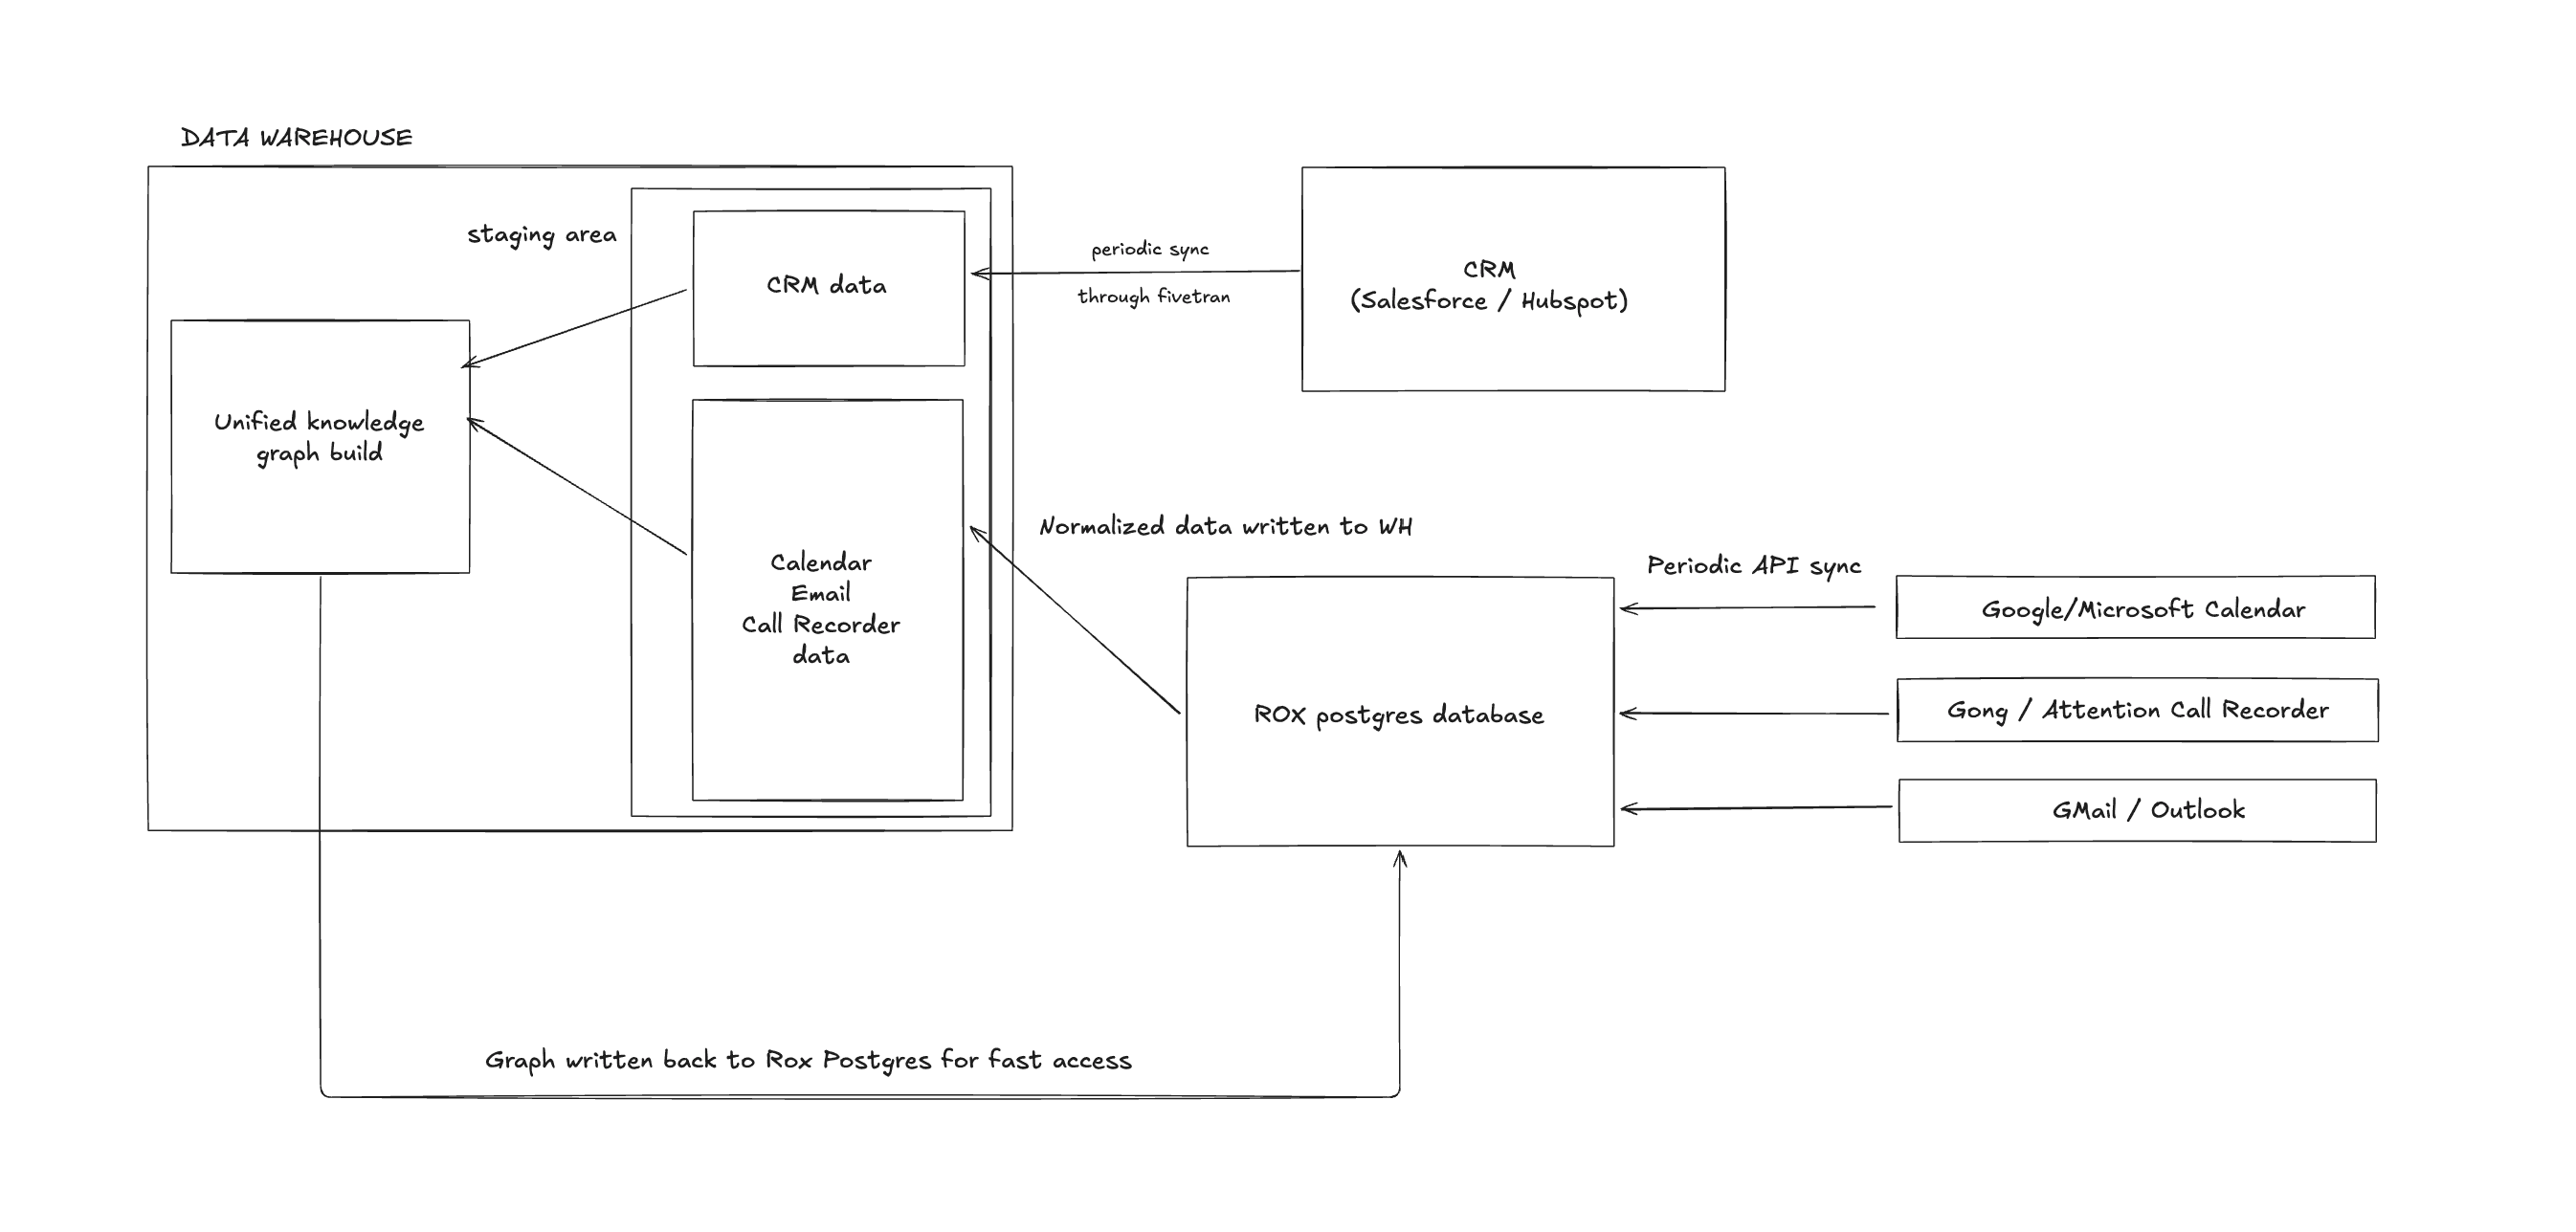
Our Normalization Pipeline
To combat this chaos, the Rox system implements a multi-stage normalization pipeline:
Source-Specific standardization: As data arrives from each vendor API, we massage it into a common schema for that source type (calendar, call recorder, CRM)
Anomaly Removal: Before copying data to the warehouse for graph processing, we apply source-specific cleanup rules:
Normalize time zones to UTC
Trim and lowercase string fields for matching
Field Mapping: We map vendor-specific fields to our canonical event schema, preserving the original values as metadata in case we need to trace back to source systems
This normalized data becomes the foundation for the next challenge: figuring out which records across these different systems represent the same real-world meeting.
The Solution: Multi-Field Entity Resolution
The core challenge: determining that a calendar event, a Gong recording, and a Salesforce activity all represent the same real-world meeting—despite different schemas, missing fields, and vendor-specific quirks.
Field Relationship Architecture
Our entity resolution system works by defining pairwise field relationships between data sources. These relationships tell the system which fields can be compared to determine if records from different systems represent the same real-world event.
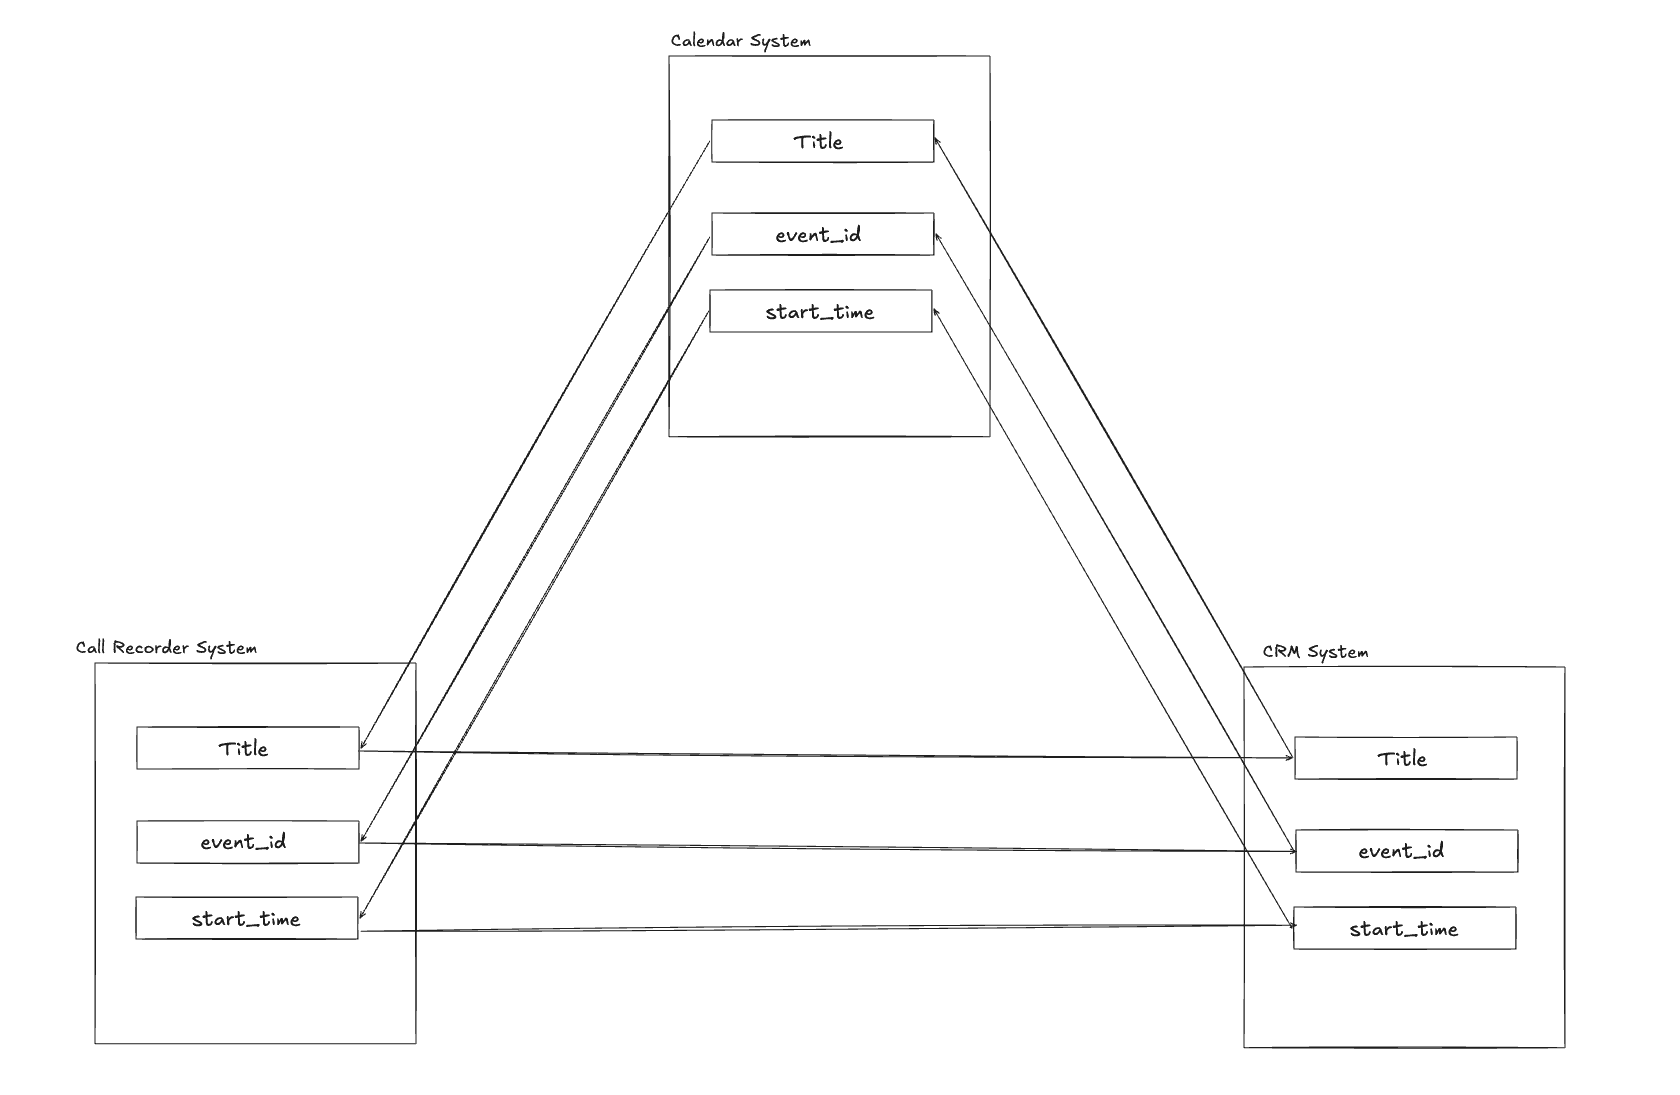
Key Design Principle: By explicitly defining which fields can be matched across systems, we enable flexible, multi-signal matching. The relationships are defined pairwise between every data source combination, allowing the system to determine entity equivalence even when some fields are missing or malformed.
When event_id is missing or malformed (common in manually-logged CRM data), the system automatically falls back to other defined relationships like title + start_time. This multi-signal approach increases recall by 35% over single-field matching.
Sequential Join Process
We process data sources sequentially, building up a unified graph but there’s a problem - After joining all sources, the same event may appear multiple times if different matching strategies created multiple candidate matches. A calendar event might match a Gong recording via event_id, and the same Gong recording might independently match a Salesforce activity via title + time. This creates duplicate unified entities that need consolidation.
The Reducer Algorithm: Intelligent Deduplication
When we resolve events, we can't simply take the "first" match—we need to intelligently consolidate duplicates while preserving the most reliable data and maintaining referential integrity across all source systems.
The Challenge: Given duplicate rows representing the same event, select the canonical representation that:
Maximizes source coverage (prefers rows with more source IDs populated)
Prioritizes reliable sources (calendar > call recorder > CRM)
Runs in O(n) time (not O(n²) pairwise comparisons) as we have millions of records.
Our Solution: A multi-pass weighted reduction algorithm.
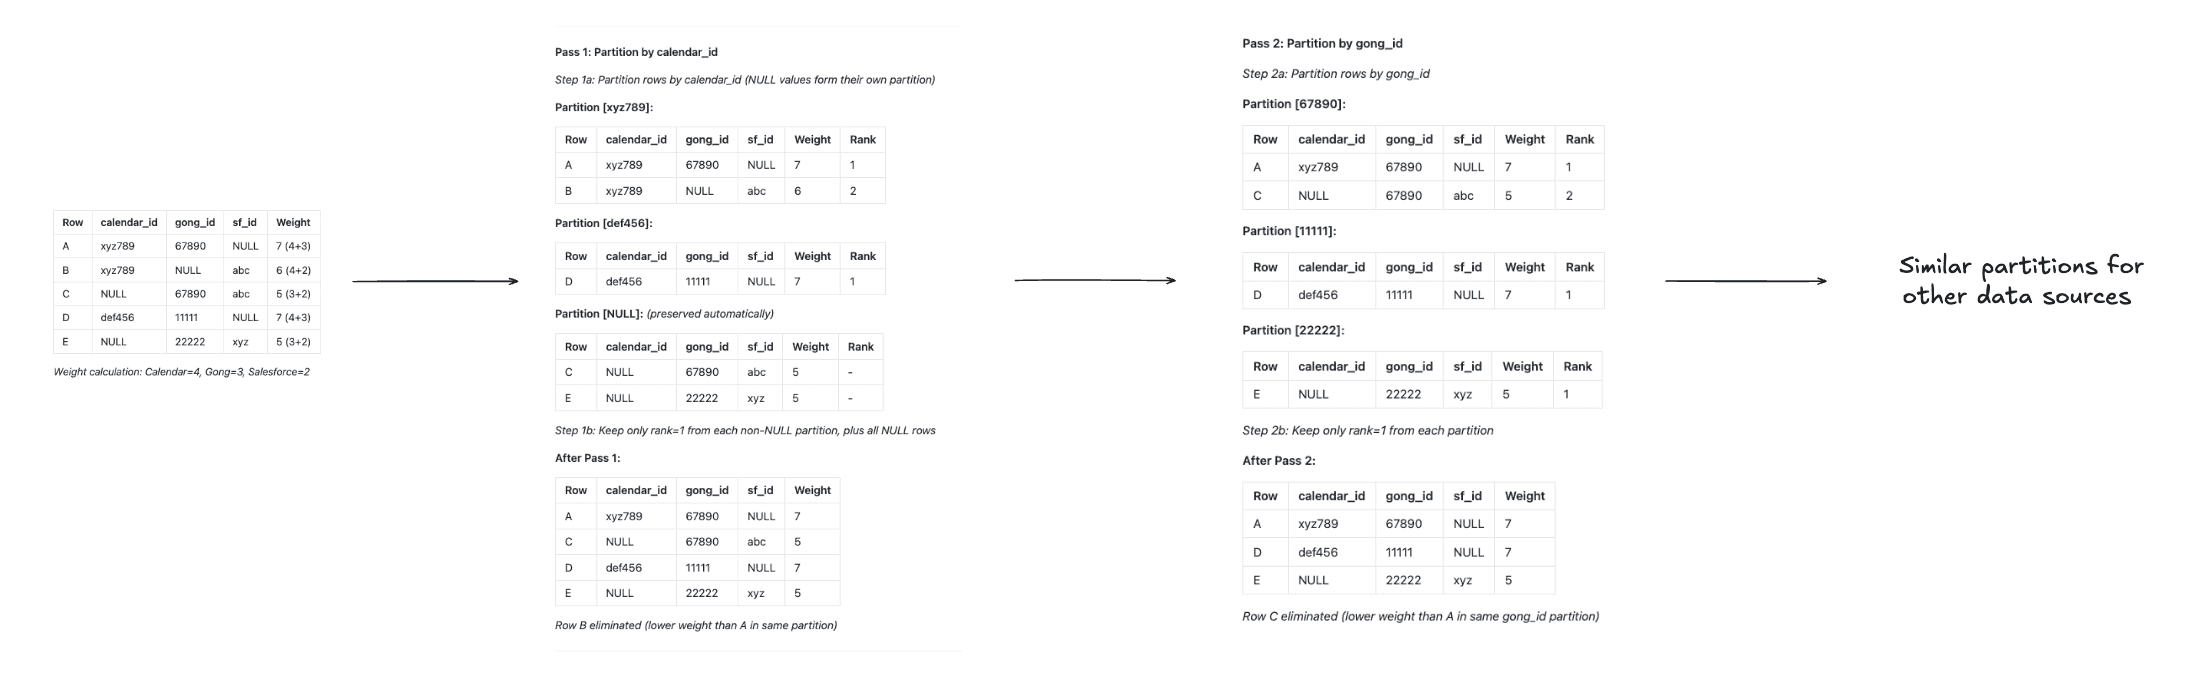
Why This Works:
Completeness: By running multiple passes (one per source column), we ensure that rows with overlapping source IDs are compared and consolidated.
Weight-Based Prioritization: Records with more sources populated naturally get higher weights, and within ties, more reliable sources (calendar > gong > crm) break the tie.
O(n) Complexity: Each pass partitions and ranks—no nested loops. Three passes handle all pairwise combinations transitively.
Correctness: If Row A beats Row B in Pass 1, and Row B would have beaten Row C in Pass 2, then Row A transitively beats Row C when they meet in Pass 2. The transitive property of "total weight" ensures consistent results.
Production Impact: This approach achieves 95%+ precision while processing millions of events in under 10 minutes per customer. The alternative—evaluating all O(n²) combinations—would be computationally infeasible at scale.
---
Outcome: A unified event graph where each row represents a unique real-world meeting, with source IDs from all systems that captured it. This foundation enables AI agents to reason about complete customer interaction history without manually correlating across silos.
Huge data problem
Now, let's talk scale. For a mid-sized customer with 500 sales reps, we're looking at:
5-10 million calendar events per year
2-3 million call recordings from Gong/Attention
3-4 million CRM activities logged manually
15-20 million email threads
Every 30 minutes, our graph refresh pipeline needs to:
Ingest hundreds of thousands of new and updated records
Process complex multi-way joins across these massive datasets
Materialize the unified knowledge graph
Write results back to Postgres for real-time querying by AI agents
The naive approach - loading everything into memory and running nested loops - would take hours and exhaust memory. We needed something fundamentally different.
Efficiency & Optimization at Scale
Hash-Based Fingerprinting
Every 30 minutes, we rebuild the knowledge graph. To preserve entity IDs across refreshes (critical for AI agent consistency), we create deterministic fingerprints from source ID combinations.
For an event with calendar_id=cal_12345, gong_id=gong_67890, sf_id=sf_event_abc, we compute: hash("cal_12345|gong_67890|sf_event_abc").
If the same ID combination appears in the next refresh, we reuse the existing entity ID. This enables O(n) hash joins instead of O(n²) nested matching—reducing rebuild time from 45 minutes to under 10 minutes for large customers.
Spark-Based Performance Optimizations
Columnar Storage: Delta Lake's columnar format enables predicate pushdown, column pruning, and data skipping via min/max statistics.
Hash Joins: By casting ID columns to consistent types (STRING), we ensure Spark's Catalyst optimizer uses hash joins—orders of magnitude faster than sort-merge joins.
Incremental Processing: We only reprocess data sources with new changes (detected via CDC timestamps), typically 5-10% of the total dataset per refresh.
Change Data Capture for Write Optimization
Writing 20 million records to Postgres every 30 minutes would cause table locks, replication lag, and massive I/O.
Instead, we compute the diff between graph versions: new_graph EXCEPT old_graph. Only 2-5% of records typically change, reducing write volume from 20M to 400K rows—a 50x improvement. Transaction commits drop from 12 minutes to under 30 seconds.
We use Postgres COPY for bulk inserts, minimizing WAL overhead.
Post-Processing Task for Meeting Transcripts
Call transcripts present a unique challenge. Unlike calendar events or CRM activities, transcripts are:
Large (often 50KB-500KB per meeting)
Slow to generate (Gong/Attention take 30-60 minutes post-meeting to generate transcripts)
Not timing-critical for the graph build
If we waited for all transcripts before materializing the graph, we'd be perpetually 30-60 minutes behind. Instead, we treat transcripts as second-class citizens in our architecture:
Graph Materialisation Happens First: We build the unified event graph using metadata (title, time, attendees, IDs) without waiting for transcripts.
Async Transcript Ingestion: As transcripts become available from vendor APIs, we ingest them into a separate
event_transcriptstable in Postgres.Post-Processing Reconciliation: A separate, asynchronous task runs after every graph build to match unlinked transcripts to materialized events.
This asynchronous approach means events become queryable within 10 minutes of the meeting ending, while rich transcript data follows 30-60 minutes later. For AI agents, this provides a progressive enhancement - they can start reasoning about "a meeting happened between these people at this time" immediately, then gain access to "here's what was discussed" as transcripts arrive.
Results & Impact
By building this unified knowledge graph, we've enabled AI agents to:
Answer complex temporal queries across data sources that would have previously required manual correlation
Provide complete context for any customer interaction, regardless of which system originally captured it
Surface insights like "which accounts have had meetings scheduled but consistently decline" or "opportunities where email engagement dropped after a specific meeting"
For our customers, this translates to:
80% reduction in time spent searching for meeting context when preparing for calls
Complete visibility into all customer touchpoints in a single interface
AI-powered insights that simply weren't possible when data lived in silos
The technical approach scales efficiently - customers with 10x more data see less than 2x increase in processing time thanks to Spark's parallelization. And by treating entity resolution as a first-class problem with sophisticated algorithmic solutions, we've built a foundation that extends beyond events to contacts, companies, opportunities, and more.
Building a knowledge graph at scale isn't just about moving data around - it's about intelligently reconciling messy, real-world information into a coherent whole that unlocks genuinely new capabilities. That's the foundation for AI agents that actually understand your business.
Similar Articles
We build with the best to make sure we exceed the highest standards and deliver real value.
