Top 6 Methods for Forecasting to Get Accurate Predictions

Rox Editorial Team

Methods for forecasting can make or break your business decisions, but 63% of business leaders believe sales forecasting is critical to their organization's success while only 27% say their forecasting method is accurate.
Forecast accuracy has declined.Only 40% of organizations report satisfactory performance, down from 53% in 2021. Poor forecasting guides you toward stock shortages, missed sales, and dissatisfied customers.
We've compiled the top 6 forecasting methods to help you improve accuracy and make decisions based on analytical insights that propel growth.
What is forecasting and its methods?
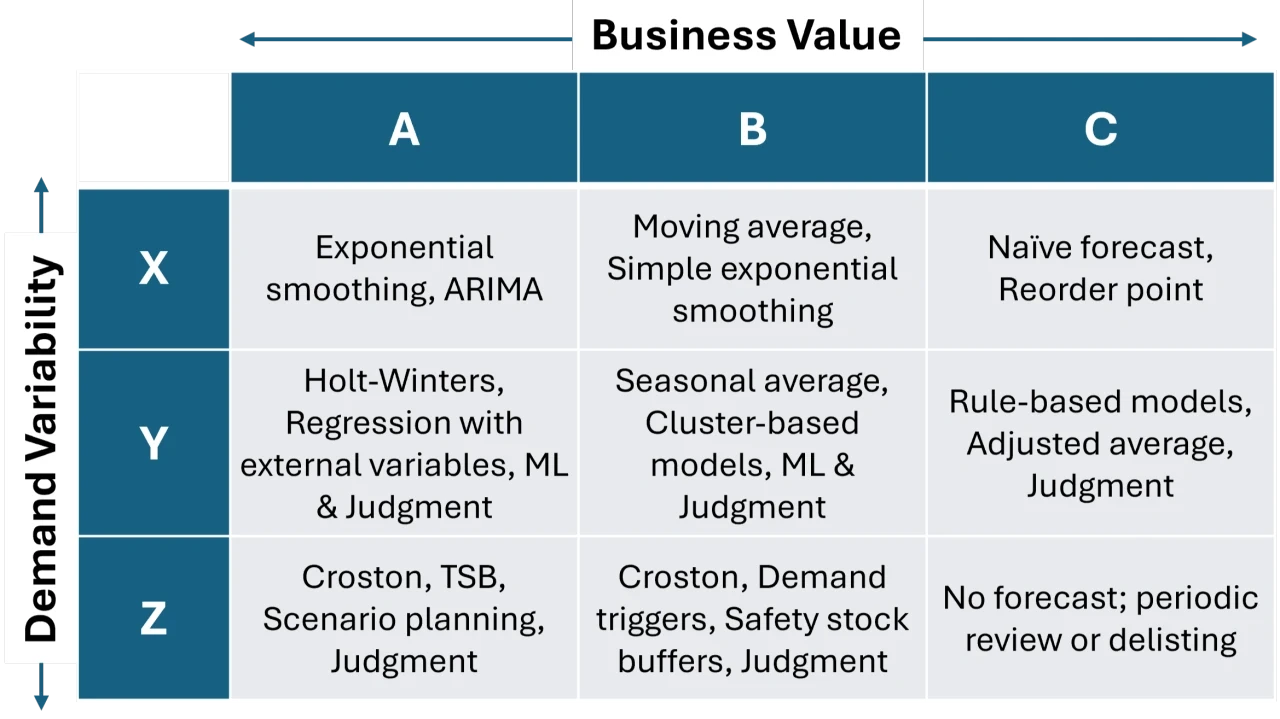
Forecasting is a method of predicting future events by analyzing patterns and uncovering trends in previous and current data. It employs mathematical approaches and statistical models to generate predictions that help businesses estimate customer demand, project sales, and allocate resources. The practice thinks about events in the past and present to cope with the effect of future uncertainty.
Businesses rely on two main categories when developing forecasts: qualitative and quantitative methods. Qualitative forecasting is based on human judgment and incorporates consumer opinions, expert insights, and executive views.
This approach uses a rating mechanism to convert qualitative information into quantitative data, though forecasts can be biased based on the expert's knowledge and intuition.
Quantitative forecasting is based on numerical data and employs mathematical models with statistical methods to arrive at predictions. AI-powered tools have made quantitative methods more powerful, reducing forecasting errors by up to 50% and cutting inventory shortages and lost sales by up to 65%.
how to forecast marketing results?
Marketing forecasting is a data analysis to predict the potential success of specific marketing efforts. It helps predict which campaigns will yield the highest ROI and makes it possible for teams to replace guesswork with an empirical, data-focused approach. Marketers can forecast demands to better line up marketing efforts with sales trends by using market research and historical data.
Data collection is the foundation of creating a marketing forecast. We just need to gather information from various sources to get a detailed view of current performance, customer behavior, and market trends. This has historical data like past sales figures and monthly revenue across product lines to identify trends and seasonal variations.
Current metrics such as website analytics, funnel metrics, and channel performance give us a baseline for forecasts. External factors also matter, as companies that think about external data like weather patterns, consumer spending power, and employment rates achieve most important business results.
Several techniques can produce marketing forecasts. The Delphi technique questions anonymous expert panelists over a series of rounds and averages the final round results. This makes it more controllable and accurate than traditional expert group interviews. Time series forecasting uses various techniques to look at historical patterns and apply them to upcoming periods.
Correlation analysis studies the relationship between different variables and traces a market factor against marketing performance to draw connections where trends move in the same direction. Response models make use of direct customer input and note customers' responses to past campaigns to predict how they'll react to future efforts.
What are top 6 methods for forecasting?
Six proven forecasting methods are the foundations of accurate predictions: the straight-line method, moving averages, time series analysis, regression analysis, qualitative forecasting, and AI-powered forecasting.
Each method serves different business needs and data scenarios. The straight-line approach works best as the starting point for businesses new to forecasting.
What is the Straight-Line Forecasting Method
The straight-line method is the simple quantitative forecasting approach that estimates future results by extrapolating prior performance. Financial analysts use historical figures and trends to predict future revenue growth.
This method assumes that a company's financial metrics will continue to grow or decline at the same rate as in previous periods. Only long-running and stable businesses use the straight-line method because it ignores any upcoming changes or fluctuations.
How the Straight-Line Method Works
Straight-line forecasts start with current performance metrics, such as revenue or cost of goods sold. Those figures are extended out based on current growth trends and follow this formula: Forecasted performance = Current performance × (1 +/- Current growth/decline rate as a decimal).
To cite an instance, if a restaurant's current annual revenue is $1.00 million and it has experienced consistent 5% annual growth, its three-year straight-line forecast would be: Year 1: $1,000,000 × (1 + 0.05) = $1,050,000; Year 2: $1,050,000 × (1 + 0.05) = $1,102,500; Year 3: $1,102,500 × (1 + 0.05) = $1,157,625.
When to Use Straight-Line Forecasting
The main advantage of straight-line forecasting is its simplicity and ease of implementation. It requires minimal data and simple mathematical skills. This makes it available for small businesses new to financial forecasting or for on-the-fly projections and comparisons.
Its simplicity can also be a disadvantage, as straight-line forecasts ignore any market volatility, seasonal fluctuations, or changing economic conditions. The method is simplistic by assuming a constant rate into the future, which is rarely the case in reality.
It's most reliable for businesses with historically stable growth patterns and may be too rigid for companies in ever-changing industries.
Straight-Line Method
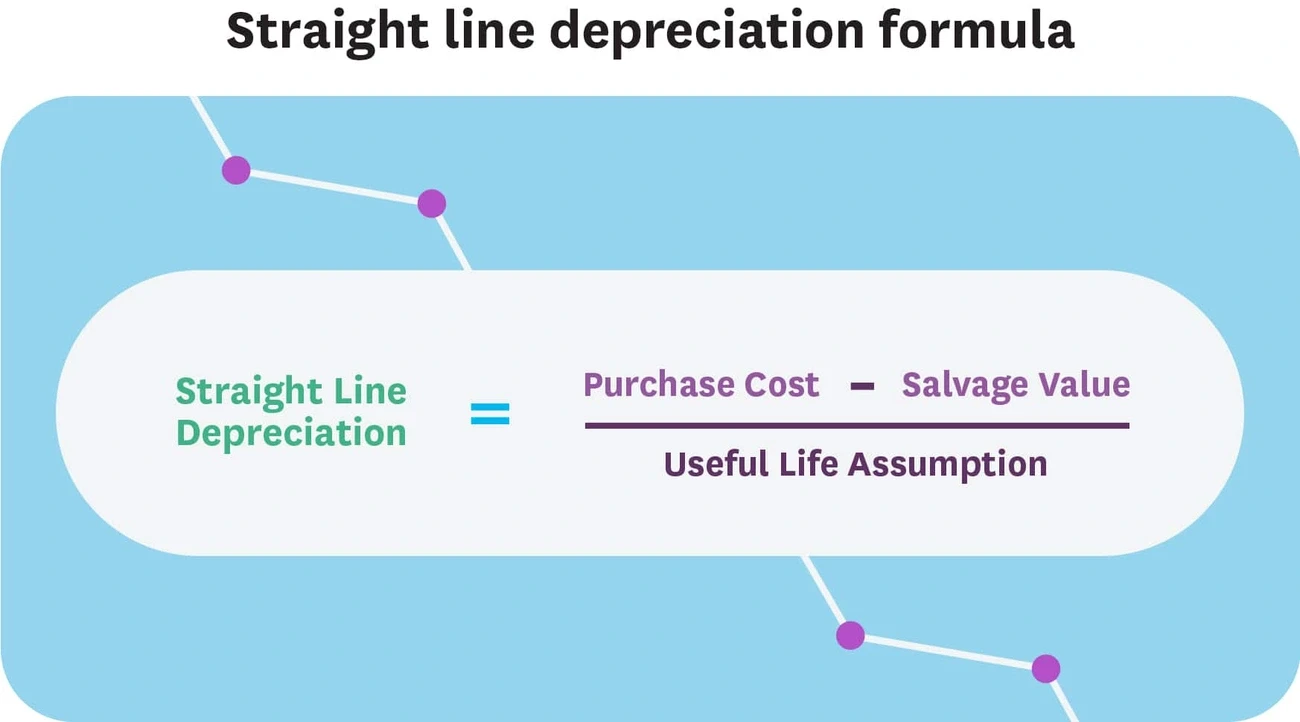
Straight-line forecasting needs a systematic approach that starts with determining the sales growth rate. A retail business can calculate this using historical performance data. To cite an instance, if we take 2016 as the base year with a 4% growth rate, we can use the formula =(C7-B7)/B7 to calculate this number.
We assume the growth will remain constant into the future and apply the same rate for subsequent years 2017 through 2021.
The second step involves forecasting future revenues. Take the previous year's figure and multiply it by the growth rate. The formula to calculate 2017 revenue would be =C7*(1+D5). Set up this formula, select cells D7 to H7, and use the shortcut Ctrl + R to copy the formula across all future periods.
A tech startup analyzing its monthly sales patterns provides another application. Sales were $50,000 in January and increased by $2,000 monthly. December's sales would be estimated at: $50,000 + ($2,000 x 11) = $74,000. This calculation helps understand short-term business budgeting.
Excel users can use built-in regression analysis tools without requiring advanced statistical knowledge. Select your revenue data and click 'Insert'. Choose the Line Chart option. The chart appears.
Select it and click the '+' symbol next to the chart. Select 'Trendline' and choose 'Linear Forecast'. The trendline will build out of the data and project into future periods. Select 'More Options' to display the equation behind the line of best fit and the R-squared value.
Validation separates accurate forecasts from spreadsheet guesses. Set aside a holdout period by reserving a recent slice of historical data. Build your forecast using only the earlier data and compare predictions against holdout actuals.
Calculate MAE and RMSE to measure accuracy. Your actuals are 100, 150, 130 and your forecasts are 110, 140, 135. Absolute errors of 10, 10, 5 give you a MAE of 8.33. Squared errors of 100, 100, 25 with a mean of 75 give you an RMSE of about 8.66.
RMSE penalizes large misses more heavily. MAE is easier to explain. If MAPE exceeds 10% on stable revenue lines, think over switching methods.
Moving Average Method
Technical traders and business analysts face a common problem: random price fluctuations and short-term noise obscure meaningful trends in their data. The moving average method addresses this by smoothing daily price movements through a constantly updated average. This makes it easier to track patterns over time.
What is the Moving Average Forecasting Method
Moving average forecasting predicts future values by calculating the average of past data points over a chosen number of periods. That average becomes the forecast for the next period.
This method takes a subset of continuous data points in a time series and calculates the mean for each time period. The calculation acts like a sliding window moving across your dataset and eliminates sudden spikes or dips to reveal underlying patterns.
The method comes in several variations. Simple Moving Average (SMA) takes the arithmetic mean of a given set of prices over a specific number of days and assigns equal weight to each data point.
Weighted Moving Average (WMA) gives more importance to recent observations by assigning weights that reflect their relative significance. Exponential Moving Average (EMA) applies decreasing weights as observations get older and makes it more responsive to new information. EMA adapts faster than SMA after a spike because it down-weights older points more aggressively.
How the Moving Average Method Works
The simple formula calculates: Moving Average = (Sum of last n periods) ÷ n. To cite an instance, if we track monthly revenue for three months at $10,000, $12,000, and $11,000, the moving average equals ($10,000 + $12,000 + $11,000) ÷ 3 = $11,000. This becomes our forecast for the next month.
Window size determines forecast responsiveness. A short window like three periods responds quickly but remains sensitive to fluctuations.
A long window like 12 periods produces smoother trends but reacts slower to changes. Fifty-day and 200-day figures are followed in trading and considered important signals.
When to Use Moving Average Forecasting
Moving averages work well with stable, low-variability items. Businesses use them for sales forecasting, traders track stock prices, and supply chains manage demand. The method filters noise and highlights long-term patterns. This makes it valuable in finance, retail, and digital marketing.
The approach has limitations. It lags behind trend changes and cannot account for seasonality. Teams prefer exponential smoothing or multi-model forecasting for faster-moving or seasonal products.
Time Series Analysis Method
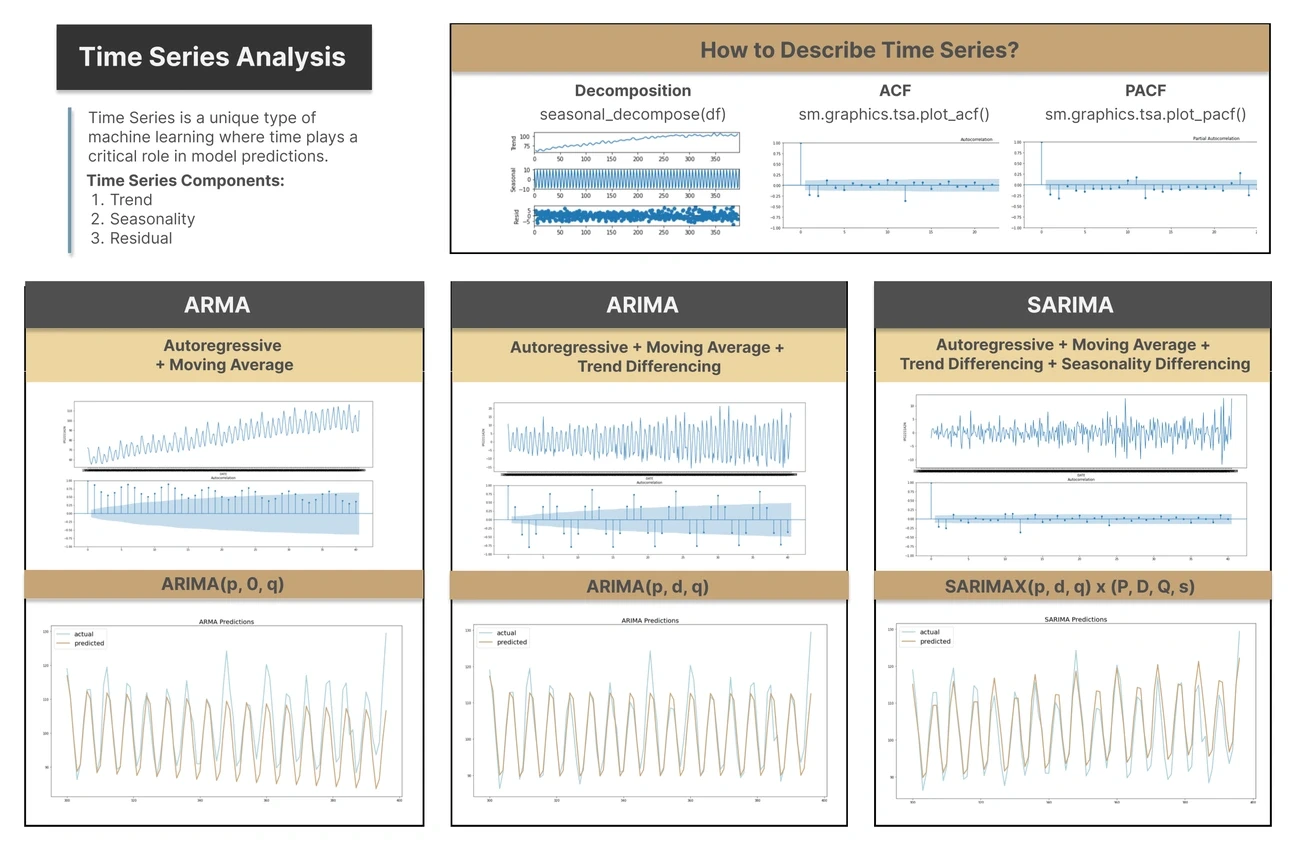
Data patterns hidden within timestamps hold the key to accurate predictions. Time series analysis gets into these patterns systematically to forecast future outcomes based on historical trends.
What is Time Series Analysis Forecasting
Time series analysis is a statistical technique used to analyze data points recorded at regular time intervals. It identifies patterns, trends and seasonal variations, making it useful to forecast results over time. The method works with time series data, which is a sequence of data points collected at specific points in time.
This enables analysis of how data changes relative to time. This approach can show likely changes in data like seasonality or cyclic behavior and provides a better understanding of data variables.
How Time Series Analysis Works
The process begins with exploratory data analysis, which has collecting raw data and preprocessing it for further analysis. Decomposition breaks down time series data into fundamental components: trends, seasonal, cyclic and remainder. This makes it easier to analyze mechanisms.
Model selection finds the most suitable model to capture patterns based on characteristics such as seasonality and trend. Model fitting trains the selected model to minimize differences between observed data and predictions.
Performance metrics such as root mean squared error calculate differences between predicted and actual values and provide a measure of accuracy.
Common models have Box-Jenkins ARIMA models, which require data to be stationary and need at least 50-100 observations for reliable forecasts. The Holt-Winters method uses exponential smoothing to predict outcomes at the time data has seasonality.
When to Use Time Series Analysis
Time series analysis works for non-stationary data that fluctuates over time constantly. Industries like finance, retail and economics use this method because currency and sales are always changing.
Stock market analysis exemplifies time series in action, especially with automated trading algorithms. The method also forecasts weather changes and supports demand forecasting.
Regression Analysis Method
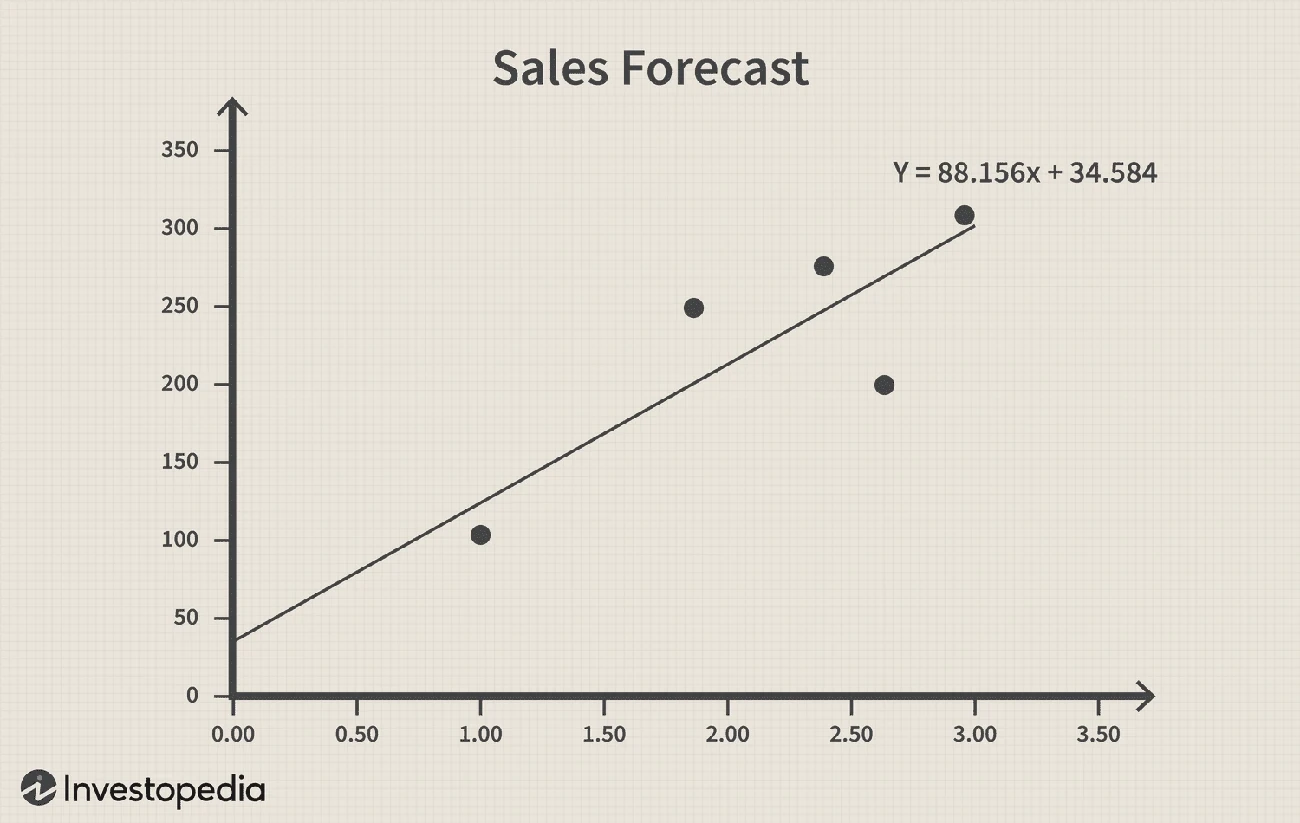
Understanding what drives your business outcomes requires you to look beyond historical patterns and get into relationships between variables.
Regression analysis serves this purpose by estimating the relationship between a dependent variable and one or more independent variables.
What is Regression Forecasting
Regression forecasting predicts future values of a metric by modeling how it changes when drivers change. We select a dependent variable (the outcome we want to predict) and independent variables (the factors that influence it).
To cite an instance, if we want to forecast sales for our company and have concluded that sales fluctuate depending on changes in GDP, sales become the dependent variable because their value depends on GDP, which serves as the independent variable.
The method also applies to scenarios where ice cream sales represent the forecast variable, with predictor variables including daily temperature and marketing budget. Regression models can involve simple linear regression with one predictor or multiple linear regression using several independent variables.
How Regression Analysis Works
We need to determine the strength of the relationship between variables. The covariance calculation shows the direction of this relationship. The covariance is positive if one variable increases and the other tends to also increase. The covariance is negative if one goes up while the other tends to go down.
We standardize covariance through correlation, which divides it by the standard deviation's product of both variables. This binds correlation between -1 and +1, where +1 suggests both variables move perfectly together and -1 implies perfect negative correlation.
The simple linear regression equation follows: Y = a + bX + ϵ, where Y represents the value we're forecasting, b is the slope, x is the independent value, and a represents the y-intercept.
When to Use Regression Forecasting
Regression works best when we want to understand how specific drivers influence results, or when upcoming changes in those drivers make simple historical trends less reliable.
Regression helps estimate the effect of those changes on future outcomes if we're planning to alter spend, coverage, or pricing. The biggest advantage is getting solid proof about what drives our business, moving beyond assumptions to make confident, evidence-based decisions.
Qualitative Forecasting Method
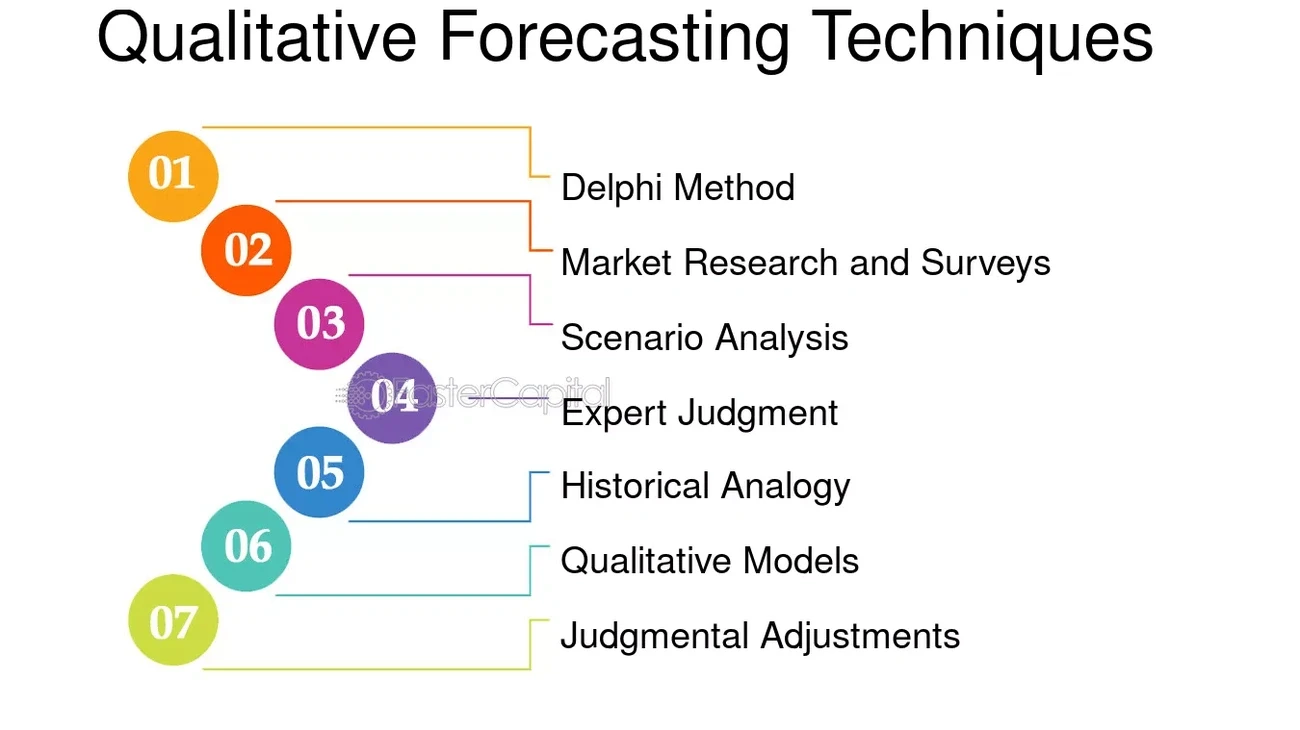
Human expertise fills gaps where numbers fall short. Qualitative forecasting is a method of making predictions that uses judgment from experts rather than numerical analysis.
This technique relies on the knowledge of highly experienced employees and consultants to give an explanation about future outcomes, which contrasts with quantitative approaches.
What is Qualitative Forecasting
Qualitative forecasting is based on human judgment and incorporates consumer opinions, expert insights, and executive views. The method applies a rating mechanism to convert qualitative information into quantitative data.
It's subjective and intuitive. It depends on the opinions and knowledge of qualified professionals. This approach could involve knowledge of customer experiences, market research, or personal experience in a field.
How Qualitative Methods Work
Three approaches dominate qualitative forecasting: expert opinion, the Delphi technique, and market surveys. Among these, the Delphi technique is widely used when businesses need expert-driven forecasts without the influence of groupthink.
The Delphi method generates a view of the future and uses knowledge from multiple experts. Questionnaires spread to team members who remain anonymous, and each makes predictions in their field. Results are analyzed and re-spread after the first round, with panel members thinking over their views again. This process repeats until a consensus emerges.
Market survey approaches involve surveying past or potential customers about future plans. Marketing staff gives valuable information through direct customer contact, while procurement staff offers market intelligence about competitors.
When to Use Qualitative Forecasting
Qualitative forecasting shines when historical data is limited or unavailable. Startups benefit because they often lack adequate historical data for accurate quantitative forecasting. The method also works when future results will depart from prior periods.
To name just one example, launching new products, entering unfamiliar markets, or facing unprecedented situations makes qualitative approaches more relevant than outdated historical data.
AI-Powered Forecasting Method
Artificial intelligence changes predictions from educated guesses into precise calculations. AI forecasting applies machine learning techniques to predict future outcomes based on historical data and analyzes big datasets to identify patterns and generate predictions that inform business decisions.
This approach removes guesswork by drawing on enormous past datasets, and accuracy improves as more data feeds the models.
What is AI-Powered Forecasting
AI-powered forecasting uses artificial intelligence to estimate future demand for products or services. It analyzes real-time and historical data along with external factors. The method deploys advanced models such as neural networks and deep learning to capture intricate, nonlinear drivers of demand.
Traditional approaches rely on simple data analysis, but AI incorporates wider data sources including IoT devices, social media, economic indicators, and weather forecasts. Research shows AI-powered forecasting can reduce errors by 20% to 50% and product unavailability by up to 65%.
How AI Forecasting Works
The forecasting process follows four steps. Data collection gathers information from CRM systems, ERP platforms, web analytics, and social media. Data preparation involves cleaning values and removing duplicates while detecting outliers. Model training uses techniques like regression or ARIMA to learn underlying patterns.
The trained model generates predictions during forecasting, which are then evaluated with metrics like MAPE and RMSE to assess accuracy. Machine learning algorithms identify relationships too complex for traditional methods and uncover connections between variables that predict demand spikes reliably.
Sign up to access AI-powered platforms that streamline this process.
When to Use AI-Powered Forecasting
AI forecasting works for industries with products that have ample historical data. Retailers use it to optimize inventory and plan campaigns. Energy providers forecast electricity demand and factor in weather and consumer behavior.
Manufacturers use AI to line up production schedules with future demand, which reduces excess inventory by 16%. Idaho Forest Group reduced forecasting time from over 80 hours to under 15 with AI.
How choose the Right Method for forecasting?
Selecting the right forecasting method depends on three factors: data availability, business stability, and prediction complexity. Match your method to your situation rather than forcing data into a predetermined approach.
Assess your historical data first. Qualitative methods provide the best starting point if you have less than two years of records or launched your business not long ago. Businesses that are three or more years old with stable performance can use straight-line or moving average approaches. Companies with extensive datasets spanning multiple cycles benefit from time series analysis or AI-powered forecasting.
Think over your business environment next. Industries facing constant change require regression analysis to model how specific drivers influence outcomes. Stable sectors with predictable patterns work well with simpler methods. Expert judgment through qualitative forecasting outperforms historical extrapolation if your market experiences dramatic shifts or you're introducing new products.
Resource constraints also matter. Straight-line and moving average methods need basic spreadsheet skills. AI-powered forecasting demands technical expertise and substantial data infrastructure. Start simple and graduate to advanced methods as accuracy requirements increase if budget limitations exist.
Your forecast accuracy requirements guide the final choice. Industry standards suggest that you invest in AI or regression models if you need precision within 5%. Traditional quantitative methods are enough for general planning where 10-15% variance is acceptable.
Which platform helps predict deal outcomes more accurately?
ORM delivers 95%+ forecast accuracy through custom mathematical models built for each client's revenue engine. Off-the-shelf tools can't match this. ORM operates as a managed service where teams construct conversion rate assumptions and pipeline coverage models tailored to company size and go-to-market motion.
The service provides prescriptive analytics that specify which deals to accelerate and where to add pipeline coverage.
Aviso positions itself with 98% accuracy claims, though independent measures suggest performance falls between 80-85%. The platform analyzes CRM data and conversation signals to generate forecasts. Gong distinguishes itself by incorporating conversation data among other pipeline metrics.
It catches behavioral signals like a champion who hasn't appeared on a call in 30 days. Clari's AI generates forecasts based on patterns across its customer base. Accuracy depends on CRM data completeness.
Salesloft Deals uses sales methodology extraction. Qualification evidence from buyer conversations replaces rep opinion as forecast input. MaxIQ reports 15% forecast accuracy improvement by combining CRM data and revenue signals. Pipedrive offers customizable Forecast Views for faster course correction, while Avercast employs over 200 algorithms for planning.
Sign up to access platforms that reshape sales forecasting methodology from guesswork into evidence-based predictions.
What are the top-rated tools for streamlining workflows and enhancing demand forecasting accuracy?
Workflow automation and demand forecasting tools address different operational needs, yet both improve business accuracy. Zapier tops the workflow automation space with over 8,000 app integrations starting at USD 19.99/month. Make offers visual integration workflows at USD 9.00/month, while ClickUp specializes in task management automation from USD 7.00/month.
Workato serves enterprises that just need governance and orchestration, though pricing requires contacting sales. Cognito Forms excels at form-to-workflow automation with conditional logic and approvals for USD 19.00/month.
Demand forecasting platforms take a different approach. Kumo.ai stands out as the only tool that reads multi-table relational data natively and captures cross-product effects like substitution and cannibalization through graph traversal.
o9 Solutions combines demand sensing with AI-powered integrated planning, though implementation takes 6-12 months with enterprise pricing in the high six figures. Anaplan connects financial and supply chain planning through scenario modeling. Blue Yonder brings decades of retail expertise with a built-in promotion engine.
DataRobot applies AutoML to time-series forecasting but requires manual feature engineering and cannot capture cross-product relationships. Infor's solution deploys in as little as 30 minutes for select ERPs.
Conclusion
Just to restate, selecting the right forecasting method depends on your data availability, business stability, and accuracy requirements. The straight-line and moving average methods work for stable businesses, while time series and regression handle complex patterns. Qualitative approaches fill gaps when historical data is limited.
AI-powered forecasting delivers the highest precision for data-rich environments. You need to move beyond spreadsheet guesswork, so sign up to access platforms that revolutionize forecasting from estimation into evidence-based predictions.
Start with your current resources and gradually advance to sophisticated methods as your accuracy demands increase.
Whether you use straight-line forecasting, regression analysis, or AI-driven models, these predicting the future methods techniques can help reduce uncertainty and improve strategic decision-making.
FAQ
who delivers the most accurate inventory forecasting engines?
Netstock delivers accurate inventory forecasting through AI-powered automation that collects, cleans and organizes large datasets. The system integrates historical sales data, supplier lead times and market trends.
Sophisticated inventory management software packages include automated forecasting that uses machine learning to improve the projection process constantly.
what are the most trusted enterprise marketing forecasting models?
Machine learning improves forecasting by analyzing much more data than traditional methods can handle. It spots patterns humans might miss and updates predictions in real time. AI-driven forecasting has become the life-blood of modern financial planning. Finance leaders describe it as a game changer for better and faster decision-making.
which platforms deliver top accuracy in demand forecasting models?
Anaplan offers cloud-based demand planning with real-time insights. Board provides enterprise-grade solutions for large businesses with global team collaboration. Workday Adaptive Planning uses machine learning for forecast accuracy and supports driver-based modeling. SAP Advanced Planning and Optimization helps with forecast accuracy and resource utilization.
which demand forecasting solutions integrate both internal and external data sources for higher accuracy?
Anaplan integrates internal and external data to provide real-time insights. Companies can adjust supply chain strategies so. External data like economic trends and weather forecasts brings greater accuracy by adding critical context that internal data may miss.
how does gong forecast compare to manual spreadsheet forecasting?
Gong Forecast is 20% more accurate than relying on CRM data alone. Brex replaced manual spreadsheet updates with Gong and eliminated labor-intensive processes where leadership spent hours updating cells. Sales forecasting is substantially more accurate when using a CRM instead of a spreadsheet.
which solutions deliver the most accurate sales projections?
Clean and up-to-date CRM data makes forecasts more reliable, though even the best operationalizing sales forecasts are rarely 100% accurate. Modern sales forecasting tools backed by good data provide enormous help in guiding strategy and decision-making.
What are the most effective future prediction methods?
The most effective future prediction methods include straight-line forecasting, moving averages, time series analysis, regression analysis, qualitative forecasting, and AI-powered forecasting. The ideal method depends on the amount of historical data available and the complexity of the forecasting problem.
Similar Articles
We build with the best to make sure we exceed the highest standards and deliver real value.
